(01)Case study — AI · Web App · Sustainability
ECO Receipt
A lightweight web app that turns a photo of a grocery receipt into a carbon footprint — an AI reads the receipt, scores the basket and suggests a couple of simple swaps. Built for the Hack2skill AI Builder Cup 2026.
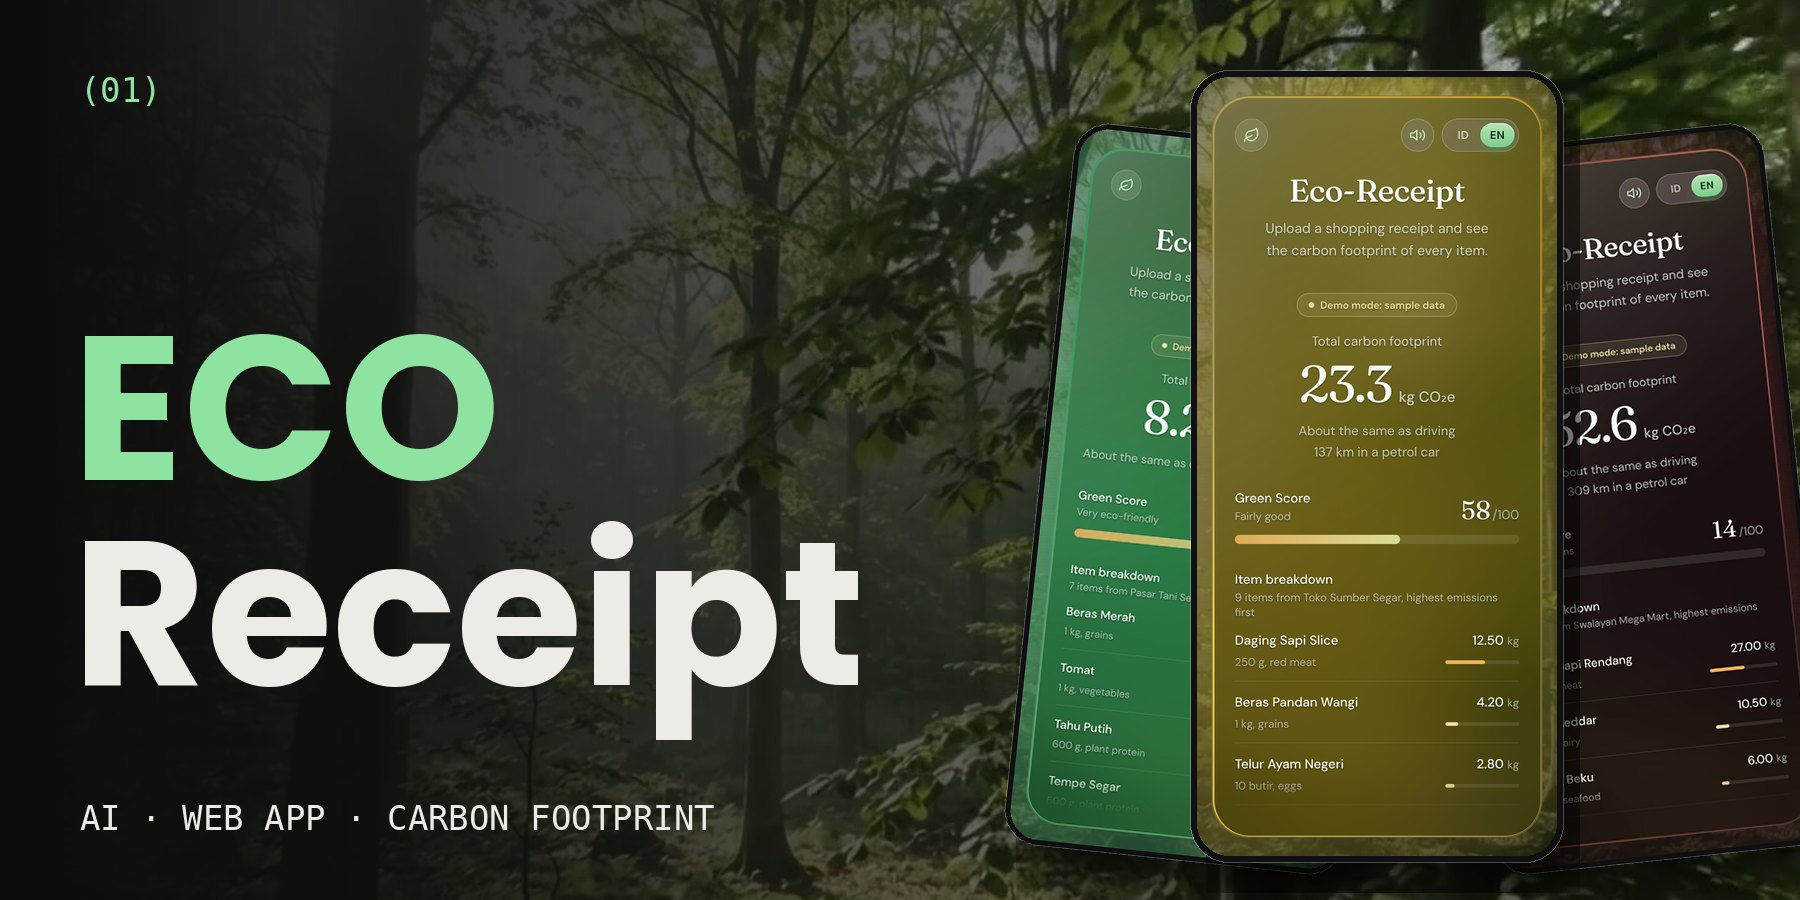
From a crumpled receipt to a clearer habit — in one photo.
Frictionless AI input
Snap or upload a receipt. A Gemini vision model reads the items, skips taxes and change, and estimates CO₂e for each one.
Micro-awareness, not guilt
Emissions become something relatable — like kilometres driven by car — plus two or three localized swaps for the next shop.
An interface that reacts
A high score brings a calm green scene with birdsong; a low one turns the screen dark red with thunder and drifting smoke.
The problem
Most people never connect a weekly grocery run with carbon emissions. Climate talk centres on factories and fuel, while individual consumption quietly adds up. Existing GreenTech tools lean B2B — checkout integrations, donation round-ups, manual searches — so the everyday shopper is left without a simple way to see what a basket really costs the planet.
Who it’s for
Everyday shoppers
People who buy groceries every week and have never seen their basket expressed in CO₂e.
Curious beginners
Students and first-timers who want to learn without installing anything or reading a report.
Households & families
Changing habits one shop at a time, with swaps that fit local food — like tempeh in place of beef.
What I designed
Receipt-to-result flow
Camera or gallery upload, local image compression to save data, then a result screen with total CO₂e, an eco score, the highest-emission items and clear advice.
Atmosphere system
The score drives the whole UI: glassmorphism over a living background, weather and smoke particles on canvas, and generative soundscapes from the Web Audio API.
Safe, forgiving AI
The model is prompted to ignore non-product lines and to reject non-receipt images such as faces or landscapes, instead of inventing results.
Demo mode & two languages
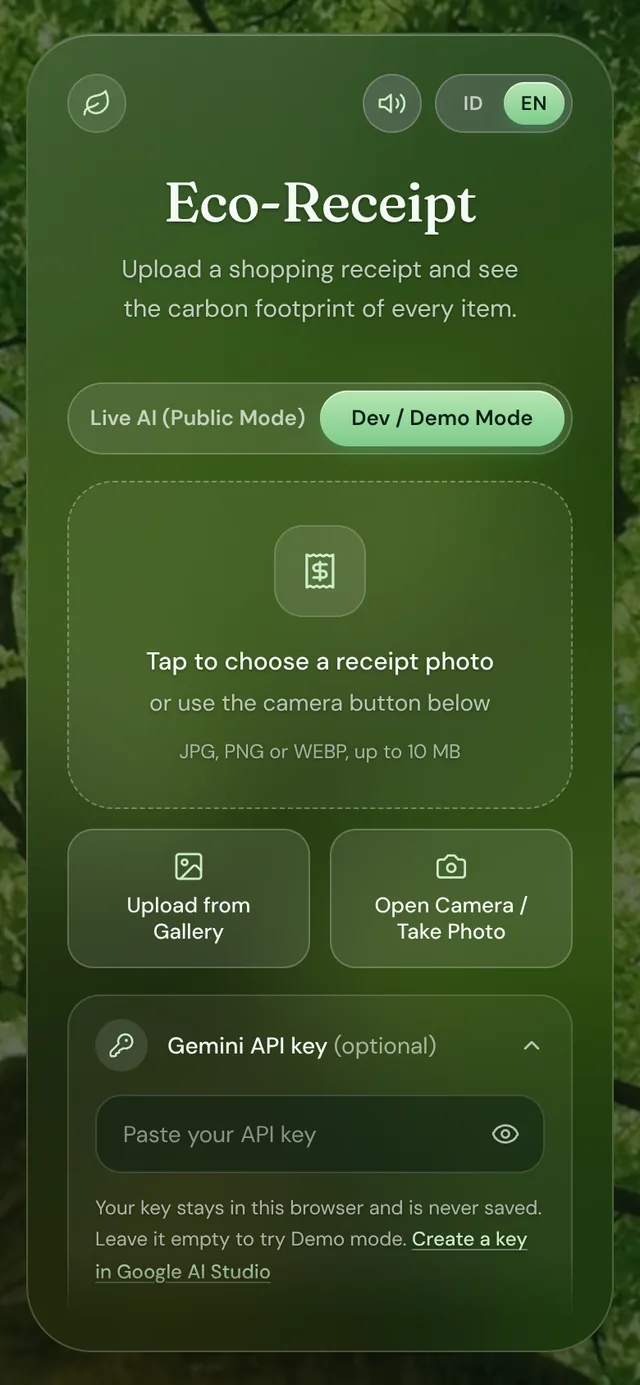
Low, mid and high carbon samples let anyone try the full experience without an API key, in English or Bahasa Indonesia.
The interface
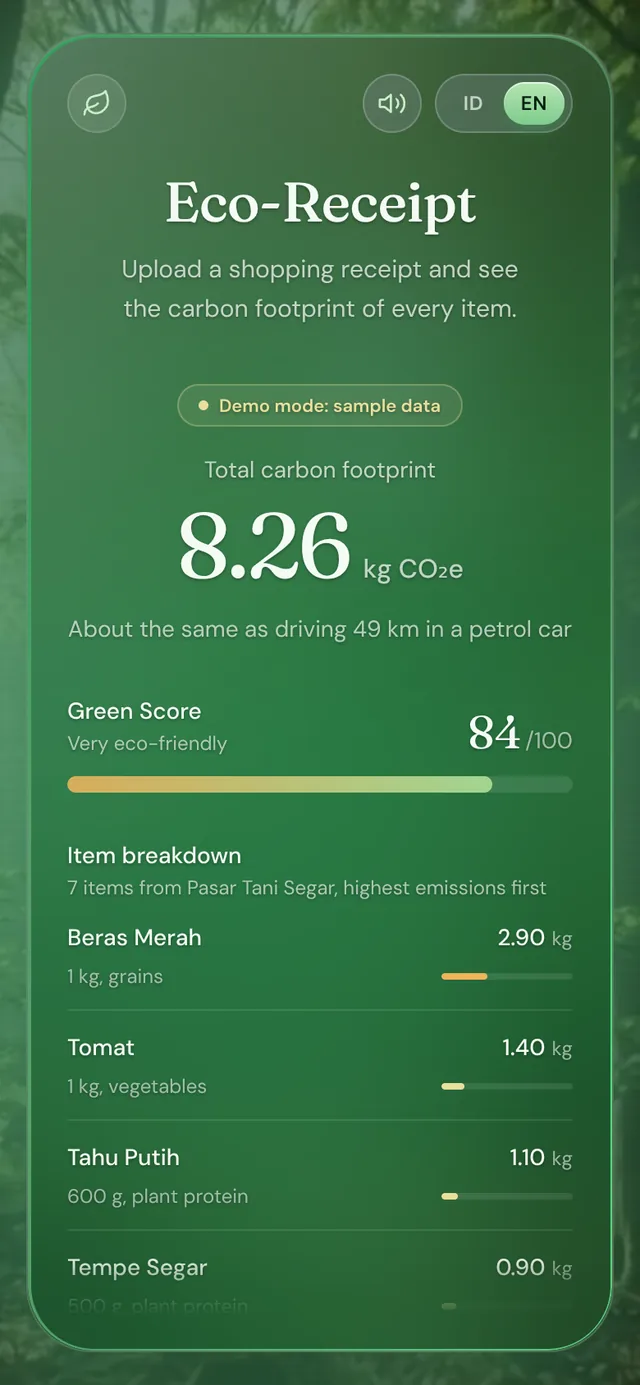
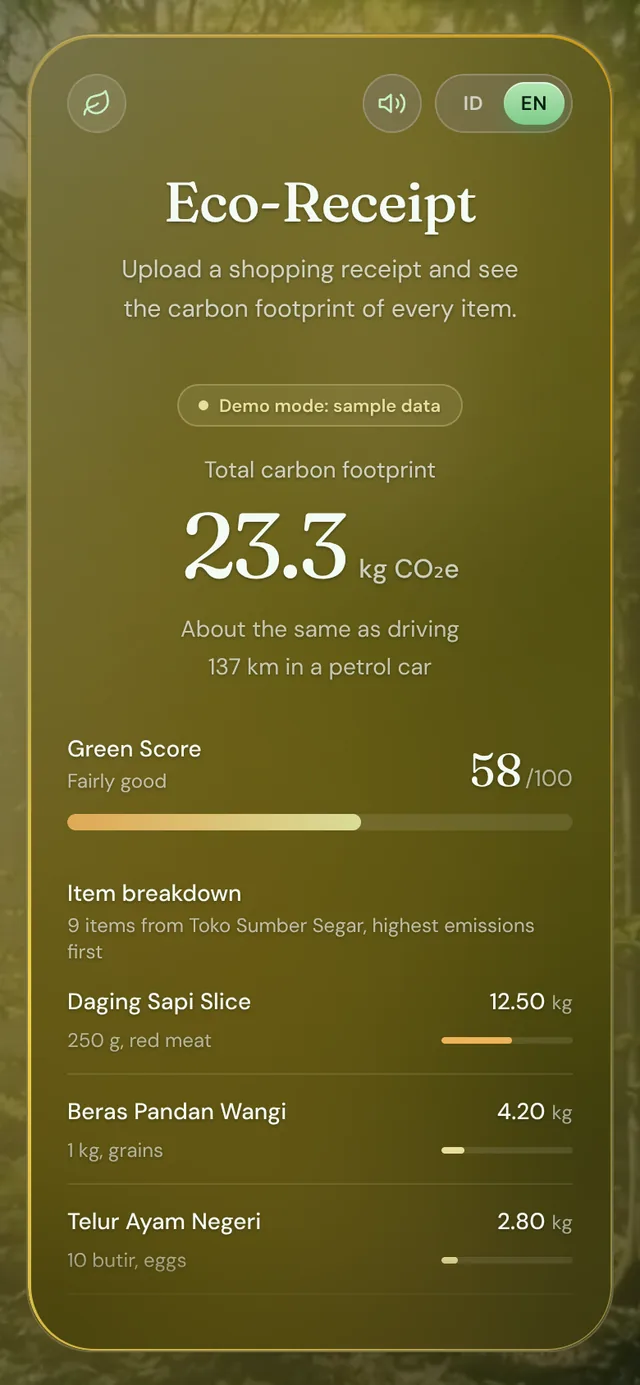
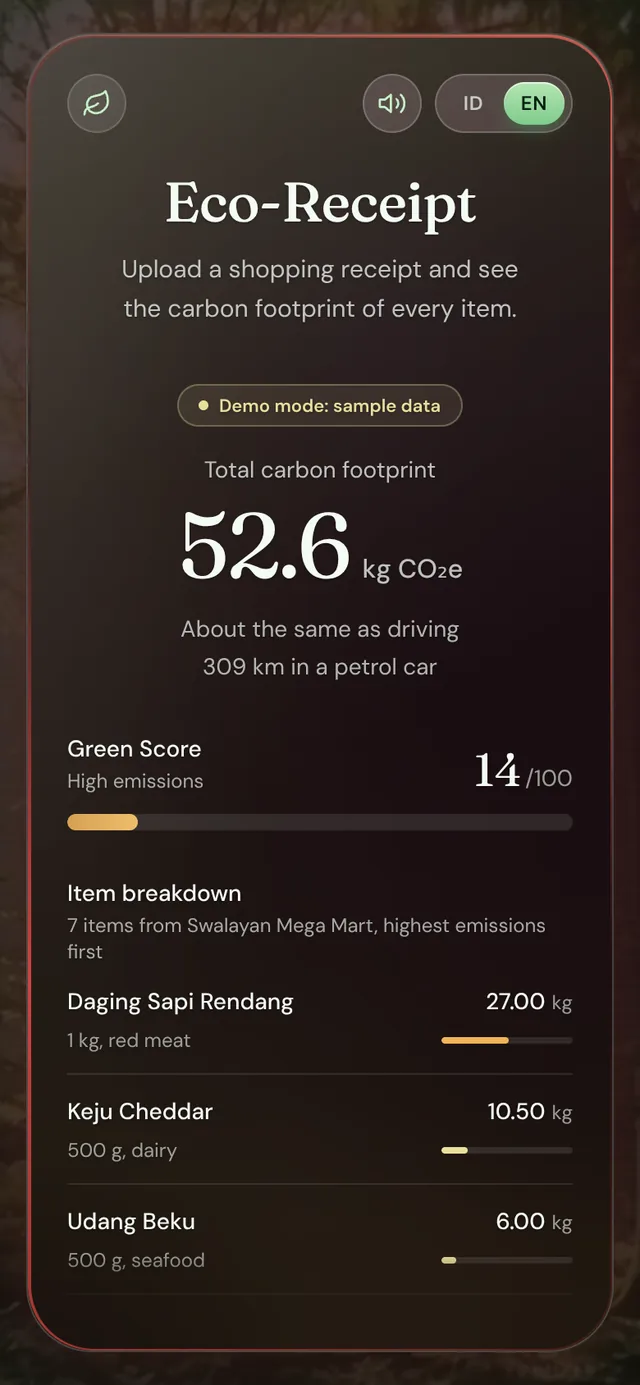
Real screens from the live prototype, captured in Demo Mode with sample data: upload, then three receipts that land on three very different results.
Reading the result
A number you can feel
Total CO₂e in large serif type, translated into something familiar: 8.26 kg CO₂e is “about the same as driving 49 km in a petrol car.”
A score with a mood
A Green Score out of 100 with a plain label — 84 “Very eco-friendly”, 58 “Fairly good”, 14 “High emissions” — while the whole card shifts from forest green to amber to ember red.
Highest emissions first
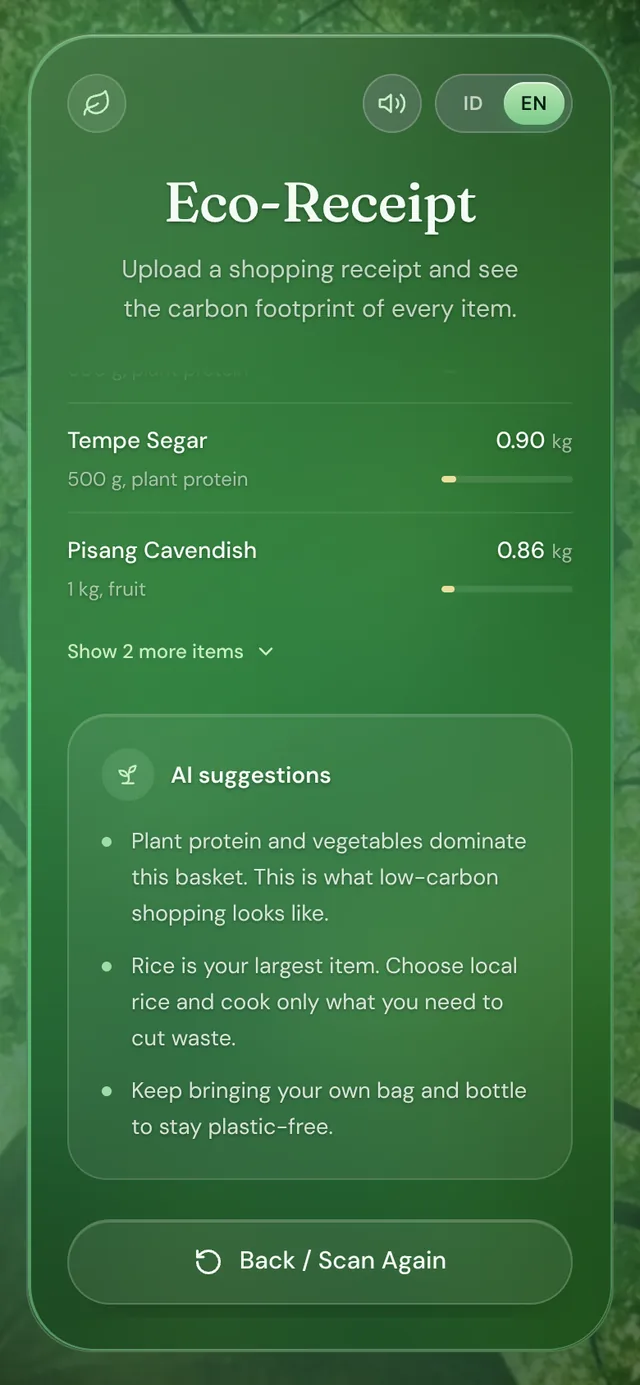
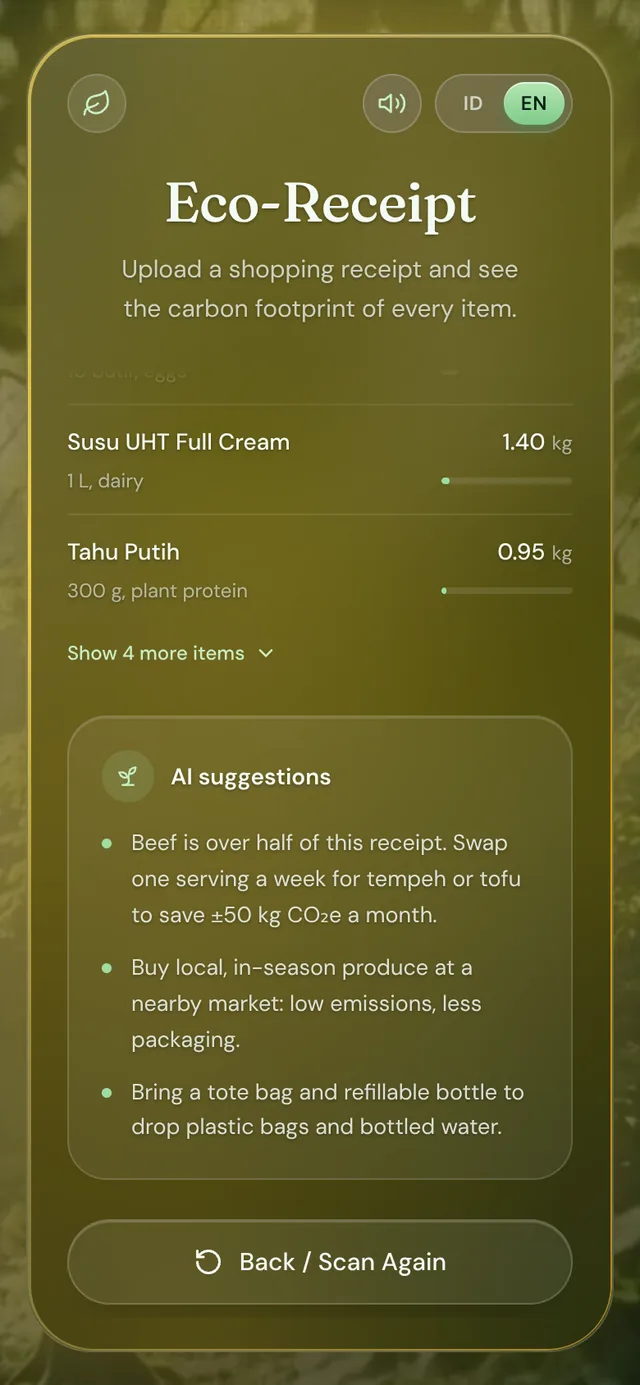
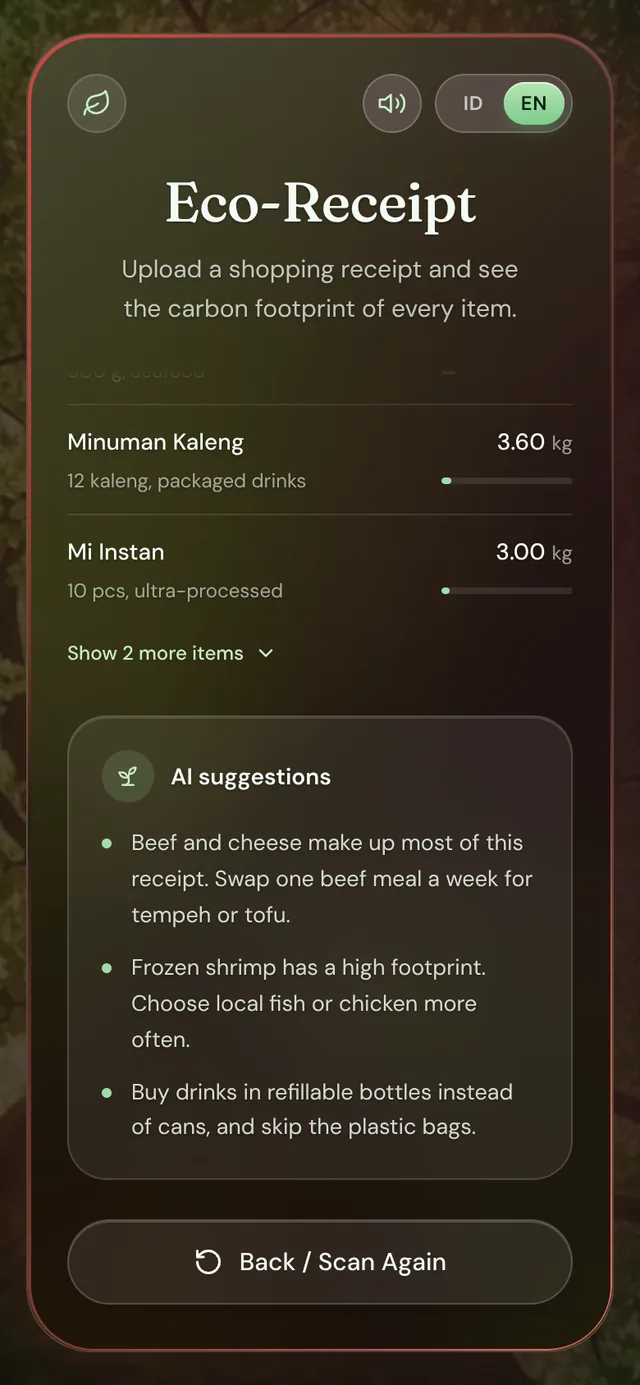
The item breakdown is sorted by impact, each row with weight, category and a bar. The long tail folds away behind “Show more items”.
Advice that fits the basket
Three AI suggestions grounded in what was bought — when beef dominates: swap one serving a week for tempeh or tofu and save ±50 kg CO₂e a month.
Honest by design
Still a prototype
A welcome sheet says it plainly: emission figures are AI estimates, not verified measurements.
Privacy up front
Receipt photos go to Google’s Gemini API for analysis. No accounts, no stored copy — and a tip to avoid receipts showing names, phone or card numbers.
Sample data is labelled
A “Demo mode: sample data” badge keeps anyone from mistaking a demo result for a real one.
How I approached it
01 — Frame the audience
Choose B2C education over enterprise dashboards: change behaviour in the pocket, at the moment of purchase.
02 — Scan the field
Review apps like Carbon Checkout, Climfy and seCOia — mostly B2B, manual entry or API-reliant.
03 — Design the feedback loop
Make the result felt, not just read: colour, motion and sound that match how the basket scored.
04 — Build with AI
Vibe-code the MVP with Gemini as coding partner, then tune the prompts and the interface until the flow felt effortless.
User flow
Five steps from a browser tab to a better next shop.
Step by step
1 · Access
Open the link — no install, works on mobile, tablet and desktop.
2 · Upload
Take a photo of the receipt or pick one from the gallery.
3 · Process
The image is compressed locally, then sent to the Gemini API.
4 · Analyze
Items are extracted, categorized and scored; tips are generated for what was bought.
5 · Result
Total footprint, eco score, top offenders and actionable advice.
Optional · Demo
Skip the key and explore with sample data.
Built with
Front end
Pure HTML, CSS and vanilla JavaScript with Tailwind via CDN — light enough to load fast on any phone.
Motion & sound
GSAP for transitions, HTML5 canvas for smoke and weather, Web Audio API for real-time soundscapes.
AI & hosting
Google Gemini multimodal model for receipt reading and carbon estimates; deployed on Firebase Hosting.
Where it could go next
Memory over time
Accounts and history, so shoppers can watch their footprint fall week by week.
Local accuracy
Emission factors tuned to Indonesian products and retailers, plus more receipt formats.
Habits & goals
Weekly goals, streaks and shareable results to keep the nudge going.
Still an MVP — a working proof that a receipt photo can become a small, useful lesson.
Try it
The live prototype runs on Firebase Hosting. Leave the API key empty to explore Demo Mode.